This doesn’t make much sense to me, as management clearly indicated it was going for size first at this stage, and wasn’t for example looking to convert any part of the Inferred resource into Measured or Indicated, as this would have been far too costly and wouldn’t provide indications of the large size potential of Moss. Another argument I heard was the expected use of historic drill core, but management already stated that most of the historic cores couldn’t be used to re-log and re-assay for the simple reason the tags were gone and/or the locations of the corresponding drill collars couldn’t be traced. Again, Moss isn’t a walk in the park, but I will try to show later on in this article the economic potential is huge, and compared to peers the undervaluation is considerable, even more so after the recent selling, although the mineralized potential and economics improved further towards a Tier I asset.
All presented tables are my own material, unless stated otherwise.
All pictures are company material, unless stated otherwise.
All currencies are in US Dollars, unless stated otherwise.
Please note: the views, opinions, estimates, forecasts or predictions regarding Goldshore Resources’ resource potential/economics are those of the author alone and do not represent views, opinions, estimates, forecasts or predictions of Goldshore or Goldshore’s management. Goldshore Resources has not in any way endorsed the views, opinions, estimates, forecasts or predictions provided by the author.
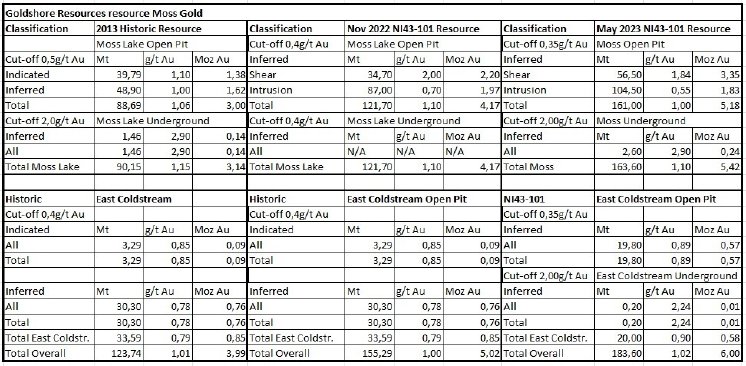
Goldshore management wasted no time, and after the maiden resource estimate (MRE) on the Moss Lake project in November of last year, they came with the first update, with hardly any delays which is pretty rare in this industry. The project is now called the Moss Gold project, and this update also incorporated a MRE for the East Coldstream deposit, which only had a historic resource up to now. Most important takeaways are the increase of the higher grade shear domain with 52% to 3.35Moz @ 1.84g/t Au, the overall increase with 24% to 5.42Moz @ 1.03g/t Au at Moss, and the healthy strip ratios, which came in at 5.2 : 1 for Moss and 6.4 : 1 for East Coldstream. Goldshore incurred discovery costs of approximately C$10 per ounce of inferred Au resource (all-in) including acquisition costs and overheads. This can also be measured as approximately 76 ounces Au per meter drilled (all-in costs included) in the 78,000 meters drilled to date, or about C$300/m all-in drilling costs.
CEO Brett Richards was pleased with the resource update:
“This announcement is an important milestone for Goldshore and the Moss Gold Project. We are pleased with the results of the resource estimate, as it illustrates the size, scale, and potential of the Moss Gold Project that we have been communicating for the past many months. This important step in the development of the Project will now shift to commencing a PEA by putting a mining project around the resource with the goal of understanding the economic outputs.
Today’s MRE is a first step towards understanding a potential first phase of the Moss Gold Project, as we believe it represents only a small portion of the mineralization or potential mineralization on our land package. We still have 29 additional targets to drill test, including several gold targets, but also 4 interesting base metal and battery mineral targets.
We will now start to run scenario planning for the PEA with respect to how we construct a Phase 1 project of a clearly larger mineral resource, while investigating various leaching methodologies, including heap leach. When we have a clear picture of the scope of the PEA, we will guide the market as to when we believe the results of it will be available to the market.”
This last remark refers back to the preliminary metallurgy results, which were announced on May 3, 2023. These were excellent because of much more detailed testing compared to earlier PEA test work, as recoveries increased by 8-13%. Current recoveries stand for Moss at 93%, and for East Coldstream at 98%. As heap leach potential was investigated too, coarse bottle roll leach test results returned gold recoveries between 53% and 64%, which encourage further investigation of a low recovery heap leach solution for low-grade mineralization. This heap leach testing is ongoing at the moment, and will probably take 150-180 days to deliver results. Management anticipates to include the results into the upcoming PEA, scheduled for late September or early October.
In order to provide some insights in the development of the resource, it seemed convenient to put together a table with the various stages so far, ranging from the historic resource at the time of acquisition of Moss Lake, to the MRE to the current resource.
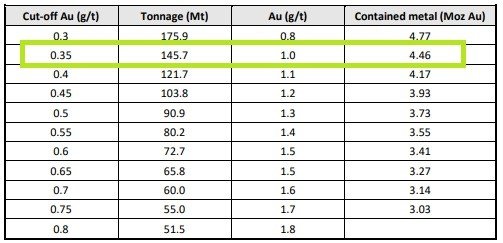
It can be seen that East Coldstream became somewhat smaller after infill drilling. Interesting features are the gradual lowering of the cut-off, and the increase of the used gold price since the MRE for Moss, from US$1500 to US$1650. This last figure is still pretty conservative, and a number which is used frequently by majors according to CEO Richards. All metrics are based on assumptions used by midtier- to major producers, in order to create a credible asset. As CEO Richards and VP Ex Flindell each have been involved in the building of several mines, they know what is needed. As the MRE provided a sensitivity to cut-off grade, it could be interesting to see how much Goldshore actually added, aside from lowering the cut-off from 0.40 to 0.35g/t Au.
It appears that lowering the cut-off provided 0.29Moz Au, so Goldshore drilled 0.96Moz Au in newly found resources, based on 12,000m of drilling since the MRE in November. All of the 122 holes for 68,732m drilled at Moss, plus the 16 holes (7,958m) drilled at East Coldstream are included in the current resource update.
The cash position is estimated at C$6.8M at the moment, which will be sufficient for the resource update, recon exploration, the PEA and some capital to be preserved for a way forward after the PEA according.
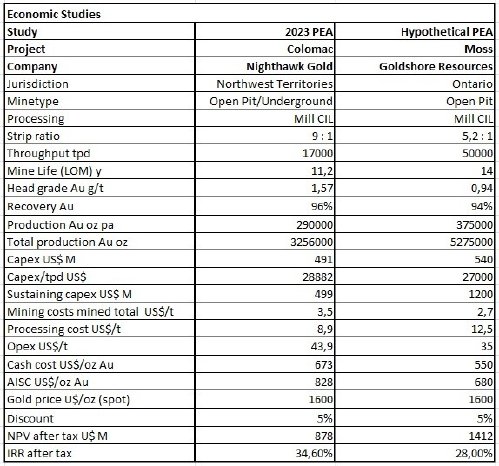
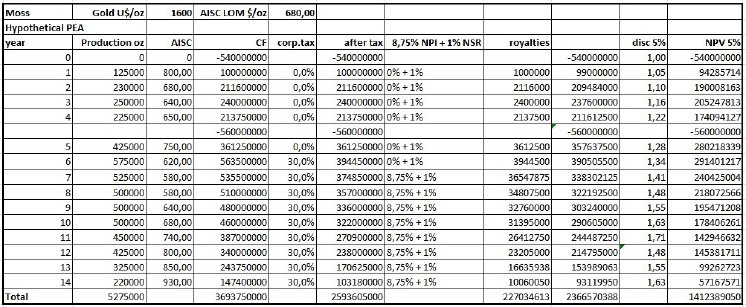
Although it is a bit early days with Moss having just an Inferred resource, I couldn’t resist looking into economic potential of such a resource. Coincidentially a peer of Goldshore, Nighthawk Gold, came out with a PEA a few weeks ago, providing us with up to date opex and capex figures. I used this information as a base case, and made a number of assumptions for Moss. Important features of Moss are the staged development (200koz > 500koz), and the processing of higher grade shears first, when stockpiling low grade intrusion ore for the first 4-6 years, dramatically improving economics. I assumed a lower head grade of 0.94g/t Au, a recovery of 94%, and a fairly high capex/tpd ratio, almost as high as Nighthawk although Stage II of Moss will be considerably larger (estimated throughput of 50,000tpd vs 17,000tpd, Stage I will be estimated at 20,000tpd). This results in the following table.
A hypothetical after-tax NPV5 of US$1.4B @US$1600 gold and a hypothetical after-tax IRR of 28% are excellent of course. Using a gold price of US$1850, the NPV5 increases to US$2.1B. Using a more conservative discount of 8%, the NPV @ US$1600 goes to US$941M, and @US$1850 to US$1.5B. I wondered if these robust figures are what CEO Richards had in mind, if he could disclose anything in this regard of course, before running scenarios with the engineers etc. He stated “Although it is premature to quantify at this stage, this is the size and scale we envisioned when strategizing a year ago, once the high-grade shear domains were identified. There are still a number of permutations required to be understood relative to the process. At this stage of assessment, we need to calibrate whether heap leach is viable, in an effort to reduce the size of the plant and balance (optimize) economic returns from a low-grade / high-grade cutoff point. Once we assess that, it will give us the visibility as to how large the plant needs to be. From there, we can optimize the process by possibly dry stacking the tailings, provide additional economic return and lowering the Capex / size of tailings dam.”
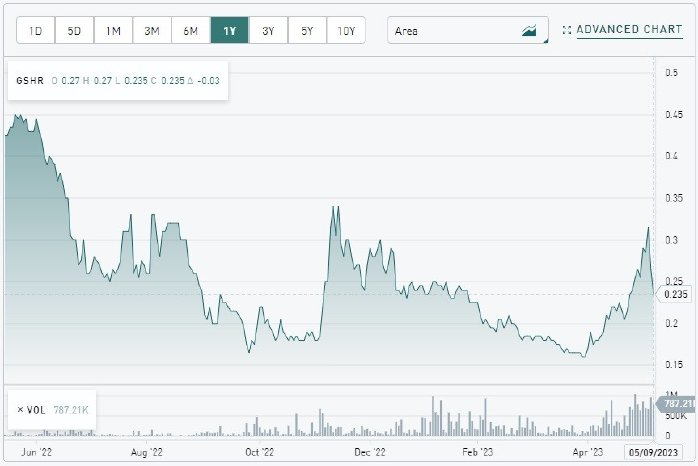
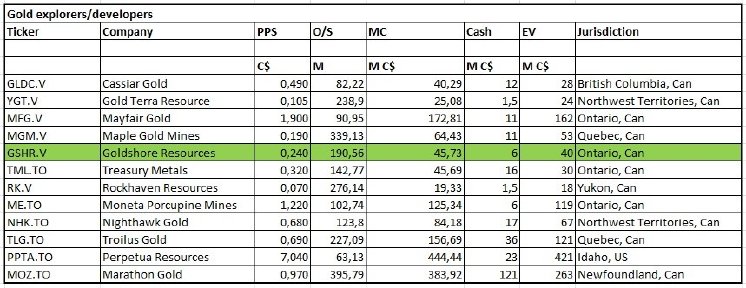
Keep in mind, Goldshore Resources is trading at a market cap of just C$44.78M, which would be about 2% of NPV5 which is pretty ridiculous, for a project in a top jurisdiction with all the necessary infra nearby or at site (power). For comparison, Nighthawk is located north in Northwest Territories, making it more remote, more vulnerable to extreme weather, and without infrastructure. I updated the peer comparison, to see where Goldshore stands now on a EV/oz point of view.
The basics: (see attachement)
EV/oz: (see attachement)
It will be clear Goldshore is valued pretty cheap on a EV/oz basis, only followed by Treasury (not very economic) and Moneta (not sure why this is trading cheap as well).
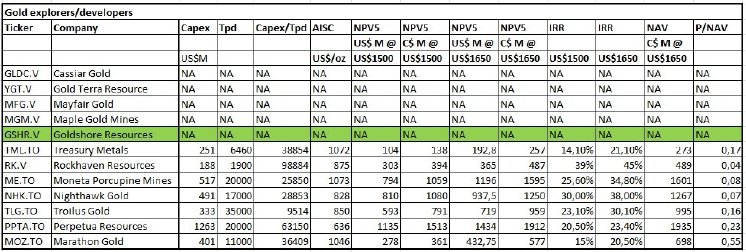
And P/NAV: (see attachement)
Coming in with an estimated NPV5 of about US$1.5B at US$1650 gold, the P/NAV would be about 0.02 which would be by far the lowest metric of all peers. There is no reason to think of as a fatal flaw for this project, like First Nations involvement or permitting, which could justify such a low valuation. In my view investors might just like to see actual proof, defined by a PEA in Q3/Q4. A subsequent re-rating seems to be inevitable for this project, managed by minebuilders although they want to set it up for a buyout within a few years, preferably supported by a strategic partner, for example a mid-tier or major producer.
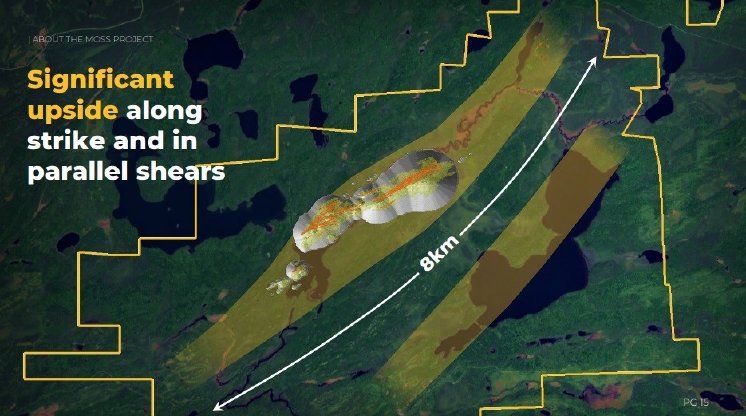
Finally, also keep in mind the vast exploration potential, as Goldshore has already identified dozens of targets along a 35km mineralized trend, and more specifically within an 8km strike zone. Exploration plans for these targets will be contemplated as soon as the PEA will be published, or maybe even sooner when a strategic partner comes in.
Conclusion
The resource update came in exactly as planned at 6Moz Au, so I couldn’t ask for more at this point. Metallurgical testwork came in better than expected, so combined with the concept of separating the shears from the intrusions, and expanding mineralization in all directions, it seems Goldshore management is advancing a pretty large and economic project. At least my back of the envelope DCF analysis seems to point into this direction, and management doesn’t seem to think it is completely unrealistic either. The recent liquity sell-off provides investors with another chance to get into this stock at likely undervalued levels, at least I am buying more these days. The wait is on for the upcoming PEA after the summer, let’s see what figures CEO Richards can come up with as I have high expectations. Stay tuned!
I hope you will find this article interesting and useful, and will have further interest in my upcoming articles on mining. To never miss a thing, please subscribe to my free newsletter at www.criticalinvestor.eu, in order to get an email notice of my new articles soon after they are published.
Disclaimer:
The author is not a registered investment advisor, and currently has a long position in Goldshore Resources. Goldshore Resources is a sponsoring company. All facts are to be checked by the reader. For more information go to www.goldshoreresources.com and read the company’s profile and official documents on www.sedar.com, also for important risk disclosures. This article is provided for information purposes only, and is not intended to be investment advice of any kind, and all readers are encouraged to do their own due diligence, and talk to their own licensed investment advisors prior to making any investment decisions.
