Why is Slow Run Mode an important feature?
When customers select a MCU, the price per unit is an important decision criterion. To save costs many manufacturers do not include an on-chip debug trace port on low-priced MCUs. If during development (and also later) problems occur, without trace port there is no way to get any detailed information on the execution of the application.
In such situations Slow Run mode is the solution.
Slow Run mode provides:
- Analysis of the complete program and data trace (which instruction was executed with what data)
- Code Coverage (what code path has been executed and what are dead code paths)
- Profiling (when, how long, which function is executing) - although in Slow Run mode time measurement is not in real time
How does Slow Run Mode work?
In Slow Run mode winIDEA executes the target application step by step and gathers CPU state information. Based on that winIDEA constructs a trace file for analysis.
The collection and processing of all of these data needs time - that's why this mode is called "Slow Run". The effective rate is at 30-50 instructions per second, dependent on the architecture used. Per default "Slow Run" is disabled in winIDEA.
Prerequisites for Slow Run Mode
Prerequisites for Slow Run Mode are the usage of an iSYSTEM debugger e.g. iC5000, iC3000 and the corresponding development environment winIDEA. The MCU only needs to provide run control debug, e.g. "single step" mode or "run until".
Comparison of trace facilities without and with Slow Run Mode
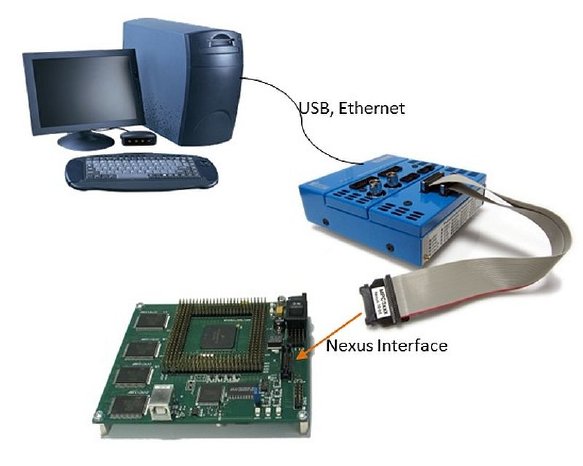
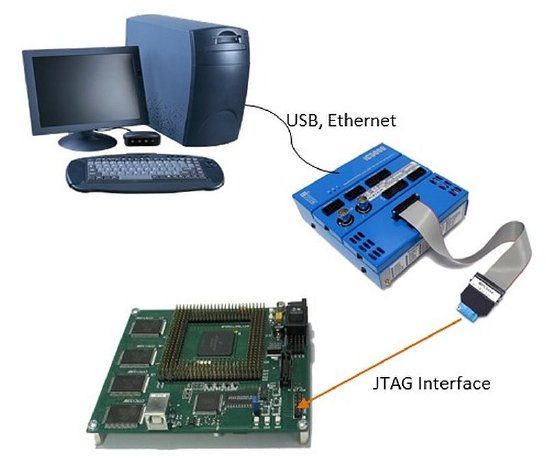
We use a test application on an iSYSTEM MPC5554 evaluation board. This board offers two interfaces: a JTAG/OnCE port (14 pins) and a NEXUS class 3 port (38pins). As debug tool we use an iSYSTEM iC5000 on-chip debugger.
In the following tests we compare what data is available over the different interfaces.
Trace over Nexus:
Details on the Nexus interface:
The Nexus interface is available in different classes. The MPC5554 evaluation board provides a Nexus class 3 interface (38pins). Nexus class 3 offers a trace port and allows additionally to Run Control Debug also real time data trace and real time read/write of memory areas without stopping the MCU.
Compared to JTAG/OnCE the data transfer rate on Nexus is 15times faster.
Debug test:
Connect the iC5000 over the Nexus interface to the MPC5554 board and start the trace.
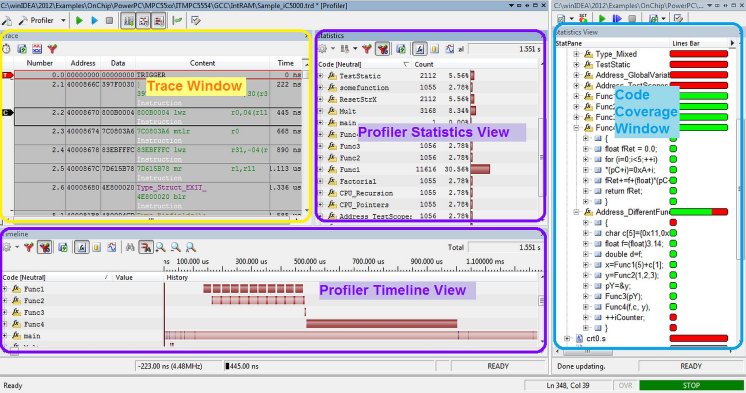
Simultaneously to program execution winIDEA shows the complete program and data trace. The data acquisition is handled in real time - without interrupting or slowing down the MCU and without effects on the application's behavior. Additionally the occurrence and reaction on external signals (e.g. AUX) can be tracked.
Based on this trace execution profiling (when, how long, which function is executing) as well as Code Coverage analysis (what source code is executed and what are "dead" code paths) is available.
"Trace" over JTAG/OnCE:
Details on the JTAG/OnCE interface:
JTAG/OnCE interface provides only Run Control debug (e.g. start/stop program execution, read/write registers, set of breakpoints and watches). A complete program execution and data trace is not available.
Compared to Nexus 3 the data transfer rate on JTAG/OnCE is 15times slower.
Debug test:
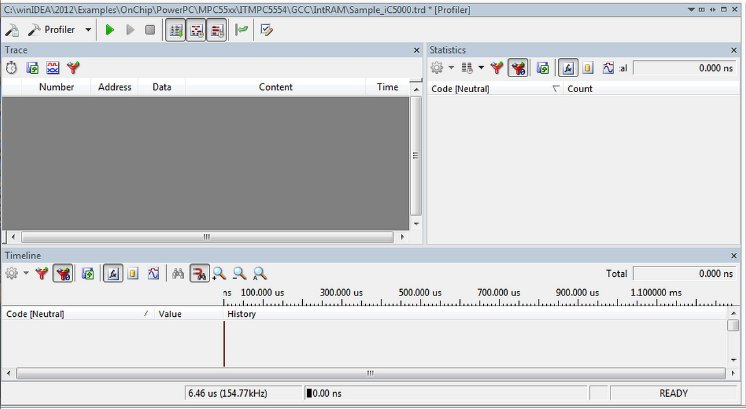
When the iC5000 is connected over the JTAG interface to the MPC5554 demonstration board, a trace is empty - it does not contain program execution or data information.
The only way to debug is analysis of the disassembly code and registers content while the program execution is manually stopped e.g. by breakpoints or run until.
"Trace" over JTAG/OnCE - using Slow Run Mode:
Details on the interface:
The interface is the same as described in section ""Trace" over JTAG/OnCE".
Debug test:
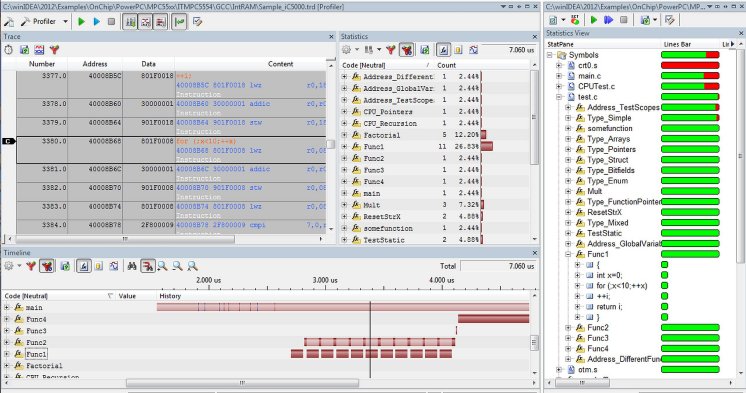
When you connect the iC5000 over the JTAG interface, select "Slow Run" ( in winIDEA's "Debug" menu) and start the trace, then you get a complete program execution and data trace (similar to the trace over the Nexus interface).
But the display of the trace data is much slower in Slow Run mode due to the step by step program execution and data acquisition.
The resulting trace file allows analysis of the program execution and data trace plus profiling and code coverage examination. But the time base is not real time.
Comparison of run times with and without Slow Run Mode
As in the previous example we use a test application on the MPC5554 demonstration board. The debug tool is again an iSYSTEM iC5000 on-chip debugger.
We track the execution duration over the Nexus 3 interface with and without Slow Run Mode.
Limitations of Slow Run
Slow Run is well-suited to trace small portions of an application.
If library functions are called (see above table), Slow Run may need a long time to return, because much code is added. Likewise the execution of a function can last very long in Slow Run mode (see above table, example "Step over").
If a trace of a complete application is needed, it is recommended to run the data acquisition in Slow Run mode overnight.
Another limitation of Slow Run mode is the possibly changed behavior of the application. Due to step by step execution the reaction on external signals e.g. timers, interrupts, can be delayed or not happen at all, e.g. if an interrupt is lost.
Conclusion Slow Run mode allows to debug and to analyze the complete program and data trace including profiling and code coverage also on MCUs without trace port.
Slow Run mode is not a substitute for powerful MCUs with trace ports and according debuggers, but it shows every developer the insights of the complete application's execution, where without Slow Run mode only teeny-weeny details are visible.
